

Economic Bulletin Issue 3, 2025
Summary
At its meeting on 17 April 2025, the Governing Council decided to lower the three key ECB interest rates by 25 basis points. In particular, the decision to lower the deposit facility rate – the rate through which the Governing Council steers the monetary policy stance – was based on its updated assessment of the inflation outlook, the dynamics of underlying inflation and the strength of monetary policy transmission.
The disinflation process is well on track. Inflation has continued to develop as staff expected, with both headline and core inflation declining in March. Services inflation has also eased markedly over recent months. Most measures of underlying inflation suggest that inflation will settle at around the Governing Council’s 2% medium-term target on a sustained basis. Wage growth is moderating, and profits are partially buffering the impact of still elevated wage growth on inflation. The euro area economy has been building up some resilience against global shocks, but the outlook for growth has deteriorated owing to rising trade tensions. Increased uncertainty is likely to reduce confidence among households and firms, and the adverse and volatile market response to the trade tensions is likely to have a tightening impact on financing conditions. These factors may further weigh on the economic outlook for the euro area.
The Governing Council is determined to ensure that inflation stabilises sustainably at its 2% medium-term target. Especially in current conditions of exceptional uncertainty, it will follow a data-dependent and meeting-by-meeting approach to determining the appropriate monetary policy stance. In particular, the Governing Council’s interest rate decisions will be based on its assessment of the inflation outlook in light of the incoming economic and financial data, the dynamics of underlying inflation and the strength of monetary policy transmission. The Governing Council is not pre-committing to a particular rate path.
Economic activity
The economic outlook is clouded by exceptional uncertainty. Euro area exporters face new barriers to trade, although their scope remains unclear. Disruptions to international commerce, financial market tensions and geopolitical uncertainty are weighing on business investment. As consumers become more cautious about the future, they may hold back from spending as well.
At the same time, the euro area economy has been building up some resilience against the global shocks. The economy is likely to have grown in the first quarter of 2025, and manufacturing has shown signs of stabilisation. Unemployment fell to 6.1% in February, its lowest level since the launch of the euro. A strong labour market, higher real incomes and the impact of monetary policy should underpin spending. The important policy initiatives that have been launched at the national and EU levels to increase defence spending and infrastructure investment can be expected to bolster manufacturing, which is also reflected in recent surveys.
In the present geopolitical environment, it is even more urgent for fiscal and structural policies to make the euro area economy more productive, competitive and resilient. The European Commission’s Competitiveness Compass provides a concrete roadmap for action, and its proposals, including on simplification, should be swiftly adopted. This includes completing the savings and investment union, following a clear and ambitious timetable, which should help savers benefit from more opportunities to invest and improve firms’ access to finance, especially risk capital. It is also important to rapidly establish the legislative framework to prepare the ground for the potential introduction of a digital euro. Governments should ensure sustainable public finances in line with the EU’s economic governance framework and prioritise essential growth-enhancing structural reforms and strategic investment.
Inflation
Annual inflation edged down to 2.2% in March 2025. Energy prices fell by 1.0% after a slight rise in February, while food price inflation rose to 2.9% in March, from 2.7% in February. Goods inflation was stable at 0.6%. Services inflation fell again in March, to 3.5%, and it now stands half a percentage point below the rate recorded at the end of 2024.
Most indicators of underlying inflation are pointing to a sustained return of inflation to the Governing Council’s 2% medium-term target. Domestic inflation has declined since the end of 2024. Wages are gradually moderating. In the last quarter of 2024 annual growth in compensation per employee stood at 4.1%, down from 4.5% in the previous quarter. Rising productivity also meant that unit labour costs grew more slowly. The ECB’s wage tracker and information from its contacts with companies point to a decline in wage growth in 2025, as also indicated in the March 2025 ECB staff macroeconomic projections for the euro area. Unit profits fell at an annual rate of 1.1% at the end of 2024, contributing to lower domestic inflation.
Most measures of longer-term inflation expectations continue to stand at around 2%, which supports the sustainable return of inflation to the Governing Council’s target.
Risk assessment
Downside risks to economic growth have increased. The major escalation in global trade tensions and associated uncertainties will likely lower euro area growth by dampening exports, and it may drag down investment and consumption. Deteriorating financial market sentiment could lead to tighter financing conditions, increase risk aversion and make firms and households less willing to invest and consume. Geopolitical tensions, such as Russia’s unjustified war against Ukraine and the tragic conflict in the Middle East, also remain a major source of uncertainty. At the same time, an increase in defence and infrastructure spending would add to growth.
Increasing global trade disruptions are adding more uncertainty to the outlook for euro area inflation. Falling global energy prices and appreciation of the euro could put further downward pressure on inflation. This could be reinforced by lower demand for euro area exports owing to higher tariffs, and a re-routing of exports into the euro area from countries with overcapacity. Adverse financial market reactions to the trade tensions could weigh on domestic demand and thereby also lower inflation. By contrast, a fragmentation of global supply chains could raise inflation by pushing up import prices. A boost in defence and infrastructure spending could also raise inflation over the medium term. Extreme weather events, and the unfolding climate crisis more broadly, could drive up food prices by more than expected.
Financial and monetary conditions
Risk-free interest rates have declined in response to the escalating trade tensions. Equity prices have fallen amid high volatility and corporate bond spreads have widened around the globe. The euro has strengthened over recent weeks as investor sentiment has proven more resilient towards the euro area than towards other economies.
The latest official statistics on corporate borrowing, which predated these market tensions, continued to indicate that the cuts in the key ECB interest rates had made it less expensive for firms to borrow. The average interest rate on new loans to firms declined to 4.1% in February 2025, from 4.3% in the previous month. Firms’ cost of issuing market-based debt declined to 3.5% in February, but there has been some upward pressure more recently. Moreover, growth in lending to firms picked up again in February, to 2.2%, while debt securities issuance by firms grew at an unchanged rate of 3.2%.
At the same time, credit standards for business loans tightened slightly again in the first quarter of 2025, as reported in the April 2025 bank lending survey for the euro area. As in the previous quarter, this was mainly because banks are becoming more concerned about the economic risks faced by their customers. Demand for loans to firms decreased slightly in the first quarter, after a modest recovery in previous quarters.
The average rate on new mortgages, at 3.3% in February, increased on the back of earlier rises in longer-term market rates. Mortgage lending continued to strengthen in February, albeit at a still subdued annual rate of 1.5%, as banks eased their credit standards and demand for loans to households continued to increase strongly.
Monetary policy decisions
The interest rates on the deposit facility, the main refinancing operations and the marginal lending facility were decreased to 2.25%, 2.40% and 2.65% respectively, with effect from 23 April 2025.
The portfolios of the asset purchase programme and the pandemic emergency purchase programme are declining at a measured and predictable pace, as the Eurosystem no longer reinvests the principal payments from maturing securities.
Conclusion
At its meeting on 17 April 2025, the Governing Council decided to lower the three key ECB interest rates by 25 basis points. In particular, the decision to lower the deposit facility rate – the rate through which the Governing Council steers the monetary policy stance – was based on its updated assessment of the inflation outlook, the dynamics of underlying inflation and the strength of monetary policy transmission. The Governing Council is determined to ensure that inflation stabilises sustainably at its 2% medium-term target. Especially in current conditions of exceptional uncertainty, it will follow a data-dependent and meeting-by-meeting approach to determining the appropriate monetary policy stance. In particular, the Governing Council’s interest rate decisions will be based on its assessment of the inflation outlook in light of the incoming economic and financial data, the dynamics of underlying inflation and the strength of monetary policy transmission. The Governing Council is not pre-committing to a particular rate path.
In any case, the Governing Council stands ready to adjust all of its instruments within its mandate to ensure that inflation stabilises sustainably at its medium-term target and to preserve the smooth functioning of monetary policy transmission.
1 External environment
Global economic activity remained steady at the start of the year, but the uncertainty surrounding US trade tariffs implies major downside risks. Global trade rebounded in the first quarter of 2025, driven by a frontloading of US imports in anticipation of a change in trade policy. Headline inflation across OECD economies decreased in February, owing to lower energy prices, while core inflation was unchanged. The inflation outlook is very uncertain: although trade tariffs and subsequent retaliatory measures could exert upward pressure on inflation in affected economies, a weakening of demand could counteract the direct inflationary effects of tariffs.
Despite the recent trade shocks, global economic activity remained steady in the first quarter of 2025. In March the global composite output Purchasing Managers’ Index (PMI) excluding the euro area increased to 52.3, from 51.7 in February (Chart 1), as services activity expanded moderately, to 52.9 from 51.6 in February. In contrast, the manufacturing output PMI fell to 50.5, from 51.9 in February. The improvement in the composite output PMI was broad-based across major economies. In the United States, the composite index rebounded sharply in March as services activity jumped to close to its long-term average and offset an abrupt deceleration in the momentum of manufacturing output. In China, output increased in both the manufacturing and services sectors, with the latter reaching its highest reading in three months. Overall, ECB nowcasting models point to steady quarter-on-quarter growth of around 1.1% in the first quarter of 2025.
Chart 1
Global output PMI (excluding the euro area)
(diffusion indices)

Sources: S&P Global Market Intelligence and ECB staff calculations.
Note: The latest observations are for March 2025.
Global trade rebounded at the beginning of 2025, but higher tariffs and the exceptionally high uncertainty surrounding trade policy are likely to lead to a marked slowdown. For the first quarter of 2025 the ECB staff nowcast points to global trade growth of 1.5% quarter on quarter. This is partly due to the significant frontloading of US imports that occurred in January and February in anticipation of broad-based tariffs, evident across a wide range of goods. High-frequency data on vessel movement, not included in the ECB nowcast, showed increased trade activity in early 2025, though a notable decline in March suggests downside risks. At the current juncture, the ECB trade nowcast does not point to a sharp slowdown in trade growth for the second quarter of 2025, as the effects of the tariff announcements are not yet reflected in the monthly indicators used by the nowcasting models. At the same time, upside risks may arise from further import frontloading due to evolving US trade policies.
Headline inflation across the member countries of the Organisation for Economic Co-operation and Development (OECD) decreased, but core inflation was unchanged. In February 2025 the annual rate of consumer price index (CPI) inflation across OECD member countries (excluding Türkiye) decreased to 2.9%, from 3.0% in the previous month (Chart 2). This downtick in headline inflation was due to lower energy prices, while the contribution of food prices remained stable. Core inflation, which excludes energy and food prices, was unchanged at 3.1%. Looking ahead, the shift towards higher tariffs in US trade policy poses risks to the global inflation outlook. On the one hand, trade tariffs, subsequent retaliation by other countries and disruptions to supply chains could push inflation upwards if the added costs are not absorbed in profit margins. On the other hand, weakening demand due to lower real incomes and elevated uncertainty could counteract the direct inflationary effects of tariffs.
Chart 2
OECD CPI inflation
(year-on-year percentage changes, percentage point contributions)

Sources: OECD and ECB staff calculations.
Notes: The OECD aggregate excludes Türkiye and is calculated using OECD CPI annual weights. The latest observations are for February 2025.
Over the review period from 6 March to 16 April 2025, Brent crude oil prices declined by 3.7% to USD 69 per barrel and by 8.4% in EUR per barrel, while European gas prices decreased by 5.7% in EUR/MWh. Oil prices fell sharply following the announcement of US “reciprocal” tariffs, as concerns about the impact of tariffs on global oil demand as well as their negative effect on risk sentiment across financial markets outweighed earlier supply-related worries. Downward pressures on oil prices were amplified by the decision by OPEC+, which was released on the same day as the announcement of “reciprocal” US tariffs, to speed up the phasing-out of earlier production cuts. OPEC+ members announced they would increase output by 411,000 barrels per day in May, up from a previous target increase of 135,000 barrels. European gas prices fell sharply, driven by demand concerns following the announcement of US tariffs. Furthermore, recent news on the progress made on an EU agreement on targets for filling natural gas storage, which would give EU countries more flexibility in meeting the 90% target for next winter, contributed to a reduction in gas prices. Metal prices declined by 6.8% on growth concerns following the US tariff announcements, even though these did not directly target metal imports. Prior to the announcements, expectations of specific tariffs on copper had prompted traders to frontload copper imports, widening the gap between prices in London and New York and filling warehouses to record levels. In contrast, food prices declined by only 1.5% following the tariff announcements, as concerns with regard to US corn supply supported prices to some extent.
In the United States, tariff announcements since the start of the year have led to a significant decline in consumer confidence, potentially contributing to a weakening of US growth. Consumer confidence fell significantly between November and April, particularly in terms of consumers’ expectations. The current drop in confidence is comparable in size to decreases seen prior to or at the start of recessions since the 1990s. Corporate confidence indicators and investment intentions have so far seen more modest declines. In line with faltering consumer confidence, real personal consumption expenditures (PCE) weakened in January and February compared with December. The US labour market has steadily cooled since wage growth peaked in mid-2022, though it remains tight. Further restrictions in US immigration policy could lead to a renewed tightening of the labour market.
US CPI headline and core inflation fell in March, coming in below market expectations, but are expected to rise as a result of tariffs. US headline CPI inflation decreased to 2.4% in March (by 0.4 percentage points compared with February), while core CPI inflation dropped from 3.1% to 2.8%. In terms of core components, goods inflation remained unchanged at -0.1% in year-on-year terms, while services inflation, although still at an elevated level, continued to slow. Headline and core market-based PCE inflation, measures to which the Federal Reserve pays close attention because they exclude imputed prices, are developing in line with the overall PCE measures but stood lower in February, at 2.2% and 2.4% respectively. Looking ahead, inflation is expected to increase as tariffs are introduced, but with significant uncertainty surrounding the inflationary impact of the policies being implemented. One-year and five-year consumer inflation expectations as measured by the University of Michigan in April recorded their most significant three-month gain since the start of monthly data, according to preliminary data.
In China, short-term economic activity indicators were higher than previously expected at the turn of the year, but domestic demand is expected to slow further. Activity data for January and February slightly exceeded market expectations, showing positive momentum in fixed asset investment, PMIs and retail sales. However, the boost provided by existing consumer stimulus programmes is expected to end, and result in a slowdown in retail sales in the coming months, unless these programmes are stepped up as put forward by some policymakers. Other high-frequency consumption indicators do not show a pick-up in momentum and remain well below historical averages. Persistently low consumer confidence also continues to hinder a broader spending recovery, while key property market indicators remain subdued, with housing construction lagging behind sales. Export growth is weakening as frontloading effects subside and the impact of higher US tariffs begins to take hold. Chinese exports to the United States declined sharply at the start of the year, after having surged disproportionately after the US elections in November. This is a pattern also observed in China’s exports to the euro area and other regions. Weakening exports are also reflected in declining prices for shipping from China’s major ports, which have fallen most significantly for exports to the United States and Europe. Additionally, the impact of US tariffs is expected to intensify, with multiple rounds of “reciprocal” and retaliatory tariffs set to raise the effective US rate on Chinese imports to around 140%, while China raised the effective tariff rate on US imports to 125% as of 12 April. China also introduced further non-tariff measures, such as export bans on additional rare earths and the inclusion of more US companies on its “unreliable entity” list.
The UK economy is likely to have gained some momentum in the first quarter of 2025 and to accelerate slightly in the second quarter. UK real GDP declined by 0.1% (month on month) in January 2025, largely reflecting weakness in manufacturing output. However, indicators of consumer and business confidence and retail sales signal a pick-up in activity in February, and the composite PMI rose from 50.5 in January to 51.5 in March, the highest level since last October. For the second quarter, real GDP growth is expected to increase slightly, to 0.3%. This should be supported by ongoing monetary easing and increasing real incomes, despite the Government’s announcement on 26 March of a set of spending cuts aimed at preserving the credibility of its fiscal targets.
2 Economic activity
Euro area economic activity softened in the fourth quarter of 2024, bringing annual real GDP growth to 0.9% in the year. Survey data point to moderate growth in the first quarter of 2025. Activity was still weak in the manufacturing sector, but confidence showed signs of improvement. At the same time, services activity continued to grow, albeit at a slower pace. Rising household incomes and a resilient labour market are supporting a gradual pick-up in consumption, although consumer confidence is fragile, and the saving rate is high. The euro area economic outlook is clouded by exceptional uncertainty. Euro area exporters face new barriers to trade, although their scope remains unclear. Disruptions to international commerce, financial market tensions and geopolitical uncertainty are weighing on business investment. As consumers become more cautious about the future, they may hold back from spending as well. At the same time, the euro area economy has been building up some resilience against the global shocks. Growth is expected to be supported by a solid labour market, higher real incomes and gradually more affordable credit, which should support consumption. Moreover, the important policy initiatives that have been launched at the national and EU levels to increase defence spending and infrastructure investment can be expected to support manufacturing activity in particular.
Euro area activity is expected to have continued to grow moderately in the first quarter of 2025 (Chart 3). According to Eurostat, euro area real GDP increased by 0.2%, quarter on quarter, in the fourth quarter of 2024. Activity is expected to have continued to exhibit moderate growth in the first quarter of 2025, as suggested by available survey data, which remained largely unaffected by the uncertainty surrounding US trade policy in the first few months of the year. The composite output Purchasing Managers’ Index (PMI), released on 3 April 2025, rose above the growth threshold of 50 in the first quarter of 2025, pointing to a modest expansion in activity. At the same time, the European Commission’s Economic Sentiment Indicator (ESI), released on 28 March 2025, also exceeded its average for the previous quarter. However, it declined in March, following two months of increases. This decline was broad-based across sectors, except for industry, where confidence rose. Survey data also indicate some rebalancing of previous sectoral differences in early 2025, as manufacturing activity showed signs of improvement, while services activity continued to grow at a moderate pace (Chart 4). The PMI manufacturing output index rose above the growth threshold of 50 for the first time in two years in March. The outcome brings the average for the first quarter to 48.8, which still points to persisting weakness but also to a substantial improvement on the previous quarter (average of 45.1). According to the ESI, confidence in the manufacturing sector also showed signs of improvement in the first quarter of 2025. At the same time, services sector activity, which has been leading the slow euro area recovery in recent quarters, continued to increase at a steady pace early in the year. The PMI services output index stood at 51 on average in the first quarter, broadly unchanged from the previous quarter and maintaining modest growth. However, economic sentiment for services deteriorated in March.
Chart 3
Euro area real GDP, composite output PMI and ESI
(left-hand scale: quarter-on-quarter percentage changes; right-hand scale: diffusion index)

Sources: Eurostat, European Commission and S&P Global.
Notes: The two lines indicate monthly developments; the bars show quarterly data. The European Commission’s Economic Sentiment Indicator (ESI) has been standardised and rescaled to have the same mean and standard deviation as the composite output PMI. The latest observations are for the fourth quarter of 2024 for real GDP and for March 2025 for the composite output PMI and ESI.
The expected recovery in the second quarter is surrounded by heightened uncertainty. Euro area GDP appears to have been on a positive trajectory in the early months of 2025. However, the outlook for the second quarter has been affected by the recent adverse global shocks – new US tariffs and possible retaliatory measures, rising global uncertainty, higher financial market volatility – as well as by more beneficial domestic shocks, such as the new national and EU policies on infrastructure and defence spending. Forward-looking indicators were already giving a mixed picture in March, most likely reflecting the headwinds from the expected US tariff announcements. PMI business expectations in 12 months’ time declined marginally in March but remained above their long-term average. In the same month, the euro area manufacturing PMI for new orders increased but remained below 50. The ECB’s recent contacts with euro area non-financial companies, which took place in mid-March 2025, before the US tariff announcements, pointed to gradually improving activity as of the second quarter and, notably, to a recovery in the industrial sector (see Box 4). However, the announcement of “reciprocal” tariffs by the United States on 2 April, coupled with the potential escalation of trade tensions, are an additional source of risk for companies and the euro area outlook. At the same time, the newly announced increases in infrastructure and defence spending may support confidence and activity in the manufacturing sector, but the positive effects would be unlikely to be visible in the second quarter. The ECB’s contacts in manufacturing indicated that rebuilding inventories and adapting production capacity for future defence output could already be helping to support activity in 2025.
Chart 4
PMIs across sectors of the economy
a) Manufacturing |
b) Services |
|---|---|
(diffusion indices) |
(diffusion indices) |
 |
 |
Source: S&P Global Market Intelligence.
Note: The latest observations are for March 2025.
The unemployment rate remains low despite signs of a gradual slowdown in the labour market. The unemployment rate stood at a record low of 6.1% in February 2025, which is 0.1 percentage points lower than in January (Chart 5). Total hours worked increased by 0.6% in the fourth quarter of 2024, driven mostly by the recovery in average hours worked. Total hours worked increased in Spain, Germany and Italy (by 1.8%, 0.6% and 0.2% respectively) and decreased in France (-0.2%). Employment growth was 0.1% in the fourth quarter of 2024 and across all sectors except industry (-0.3%). Nevertheless, the labour market continues to show signs of gradual cooling. The job vacancy rate stood at 2.5% in the fourth quarter of 2024, continuing its steady decline from its peak in 2022. The vacancy-to-unemployment ratio returned to 2021 levels and the indicator of labour as a factor limiting production stood at 24.5% for services and 14.8% for industry in the first quarter of 2025, down from 26.5% and 16.4% respectively in the fourth quarter of 2024.
Chart 5
Euro area employment, PMI assessment of employment and unemployment rate
(left-hand scale: quarter-on-quarter percentage changes, diffusion index; right-hand scale: percentages of the labour force)

Sources: Eurostat, S&P Global Market Intelligence and ECB calculations.
Notes: The two lines indicate monthly developments, while the bars show quarterly data. The PMI is expressed in terms of the deviation from 50, then divided by ten. The latest observations are for the fourth quarter of 2024 for employment, for March 2025 for the PMI assessment of employment and for February 2025 for the unemployment rate.
Short-term indicators suggest that the labour market will continue to cool in the first quarter of 2025. The monthly composite PMI employment indicator was broadly neutral, increasing from 49.2 in February to 50.4 in March (Chart 5). The composite outturn edged up across all sectors. Perceptions of employment growth remained in contractionary territory in the manufacturing and construction sectors, while rebounding into expansionary territory in the services sector. Nevertheless, the PMI for employment in the services sector remains well below its 2024 average. Overall, looking ahead, weaker employment dynamics should support a gradual recovery in labour productivity.
Private consumption continued to grow robustly in the fourth quarter of 2024 and is likely to have moderated at the beginning of 2025. Private consumption expanded by 0.4%, quarter on quarter, in the fourth quarter of 2024 (Chart 6, panel a). Goods consumption increased by 0.8%, at a faster pace than services consumption, which rose by 0.4%. Meanwhile, the saving rate stabilised at 15.3% in the fourth quarter, partly reflecting elevated consumer uncertainty and subdued confidence. The volume of retail sales increased by 0.1% in the first two months of 2025 relative to the fourth quarter of 2024, while services consumption expanded by 0.4% in January compared with the same period. Incoming data continue to point to ongoing, albeit more moderate, household spending growth at the beginning of 2025. The European Commission’s consumer confidence indicator edged down in March (Chart 6, panel b). This softening in consumption sentiment occurred alongside a noticeable decline in business expectations for contact-intensive services, indicating a potential moderation in demand for services. By contrast, the ECB’s latest Consumer Expectations Survey finds that planned spending on holidays for the next 12 months remains robust. At the same time, consumer expectations for major purchases over the next 12 months improved further in March but, on average, were broadly unchanged in the first quarter of 2025 compared with the previous quarter. Looking ahead, persisting economic policy uncertainty, particularly in the context of global economic developments, should continue to weigh on households’ spending decisions. However, higher purchasing power – reflecting the slowdown in inflation – and further rises in real labour income are expected to continue to support consumption in the quarters ahead.
Chart 6
Consumption and consumer expectations
a) Real private consumption |
b) Consumer confidence and expectations |
|---|---|
(quarter-on-quarter percentage changes and percentage point contributions; percentage of gross disposable income) |
(standardised percentage balances) |
 |
 |
Sources: Eurostat, European Commission and ECB calculations.
Notes: In panel a), real private consumption refers to the national concept and the components refer to the domestic concept of consumption. The latest observations are for the fourth quarter of 2024. In panel b), business expectations for demand in contact-intensive services and retail trade expectations refer to the next three months, while consumer expectations for major purchases refer to the next 12 months. The contact-intensive services series is standardised for the period January 2005-19, owing to data availability, whereas the other three series shown in the chart are standardised for the period 1999-2019. “Contact-intensive services” include accommodation, travel and food services. The latest observations are for March 2025.
Business investment grew robustly in the fourth quarter of 2024 but has likely weakened in the first quarter of 2025. Non-construction investment (excluding Irish intangibles) increased by 0.7% in the fourth quarter of 2024. This increase stemmed from a rebound in transport equipment investment, while machinery and other equipment contracted, and intangibles were flat. Investment is expected to have stagnated in the first quarter of 2025 – as evidenced by capital goods data, which show a slight contraction in industrial production as well as still subdued PMI output, PMI new orders and European Commission economic sentiment (Chart 7, panel a). The outlook for the second quarter and beyond is equally weak, as suggested by the April Sentix confidence indicator measuring euro area investors’ outlook six months ahead, which saw the largest drop following Russia’s invasion of Ukraine in February 2022. The latest ECB surveys, conducted before the US Administration’s tariff announcements on 2 April, point to a gradual pick-up in investment this year, amid heightened uncertainty. The ECB’s recent contacts with euro area non-financial companies, suggest that elevated uncertainty could delay investment, but also signals potential for building and adapting capacity for future infrastructure and defence spending (see Box 4). The Survey on Access to Finance of Enterprises reports some improvement expected for investment activity in the second quarter of 2025 from subdued levels. In sum, the expected gradual rise in demand, new national and EU policies on infrastructure and defence spending, along with generally more benign financing conditions, would support investment growth in the future. However, there are downside risks related to tariffs, elevated uncertainty and the potential transmission of the recent increase in government bond yields to lending conditions for non-financial companies, including the slight deterioration in the credit outlook as indicated by the ECB’s April 2025 bank lending survey.
Chart 7
Real private investment dynamics and survey data
a) Business investment |
b) Housing investment |
|---|---|
(quarter-on-quarter percentage changes; diffusion indices and percentage balances) |
(quarter-on-quarter percentage changes; diffusion index and percentage balances) |
 |
 |
Sources: Eurostat, European Commission (EC), S&P Global Market Intelligence and ECB calculations.
Notes: The lines indicate monthly developments, while the bars refer to quarterly data. The PMIs are expressed in terms of the deviation from 50. In panel a), business investment refers to non-construction investment excluding Irish intangibles. Monthly data reflect the capital goods sector. The latest observations are for the fourth quarter of 2024 for business investment and for March 2025 for the PMIs and the European Commission’s confidence indicator. In panel b), the line for the European Commission’s activity trend indicator refers to the building and specialised construction sector’s assessment of the trend in activity over the preceding three months. The latest observations are for the fourth quarter of 2024 for housing investment and for March 2025 for the PMI and the European Commission’s indicator.
Housing investment declined again in the fourth quarter of 2024, albeit at a slower pace than in the third quarter. Housing investment fell by 0.3%, quarter on quarter, in the fourth quarter of 2024, following a 0.6% decline in the previous quarter (Chart 7, panel b). Looking at hard indicators, residential building permits remained at low levels in the fourth quarter, pointing to limited support from new projects in the near term. More recently, a composite index for building construction and specialised construction activities in January stood 0.8% above its level in the fourth quarter. However, survey-based activity measures, such as the PMI for residential construction output and the European Commission’s indicator for building and specialised construction activity in the last three months, remained subdued up to March, despite some improvement. Overall, this suggests that housing investment is likely to have broadly stagnated in the first quarter of 2025. Looking ahead, recent ECB surveys point to persistently weak momentum in housing investment in the coming quarters. The latest Consumer Expectations Survey signals that household expectations for the housing market, as reflected by the attractiveness of housing as a good investment, have moved sideways, hovering around their average levels in the months up to March. The ECB’s April 2025 bank lending survey indicates that demand for housing loans is expected to continue to improve, but credit standards may tighten in the second quarter of 2025 (see Section 5, “Financing conditions and credit developments”).
Euro area exports continue to show subdued dynamics, despite an uptick in January. In January 2025 euro area goods exports increased by 0.5% in three-month-on-three-month terms, marking the first rise since April 2024. This was in part due to a surge in Irish chemical exports to the United States, which may suggest frontloading ahead of impending tariffs. Despite this uptick, the underlying export momentum remains subdued, with ongoing competitiveness challenges reflected in PMI export orders, indicating contraction in both the manufacturing and services sectors. The recent appreciation of the euro, particularly against the US dollar and the Chinese renminbi, is also adding to the headwinds by potentially eroding price competitiveness in key markets. Timely shipping data do not show that frontloading is pushing up euro area exports to a large extent, although there is some anecdotal evidence in specific sectors such as chemicals (including pharmaceuticals) and automotives. Euro area imports rose by 0.3% in three-month-on-three-month terms, with a relatively strong contribution from China. The appreciation of the euro against the Chinese renminbi and the US dollar may reduce costs for imports priced in those currencies, especially for commodities which are priced in US dollars. However, potential tariff expansions and EU retaliation could offset these benefits. Additionally, higher defence spending may drive short-term import growth, particularly in high-tech military equipment. Looking ahead, the trade outlook is highly uncertain, with potential tariff increases and a deterioration in global economic conditions posing significant risks.
Overall, the outlook for euro area activity has deteriorated owing to rising trade tensions. Increased uncertainty is likely to reduce confidence among households and firms, and the adverse and volatile market response to the trade tensions is likely to have a tightening impact on financing conditions. These factors are expected to weigh on euro area activity by the second quarter of 2025. At the same time, the euro area economy has been building up some resilience against global shocks. Medium-term growth is expected to be supported by a solid labour market, higher real incomes and gradually more affordable credit, which should bolster consumption. Moreover, the important policy initiatives that have been launched at the national and EU levels to increase defence spending and infrastructure investment can be expected to support manufacturing activity, which is also reflected in recent surveys.
3 Prices and costs
The disinflation process is well on track. Euro area headline inflation decreased to 2.2% in March 2025, from 2.3% in February. This decline was mainly due to a drop in energy prices and a further easing in services inflation, which lessened markedly over recent months. Most measures of underlying inflation are pointing to a sustained return of inflation to the ECB’s 2% medium-term target. Annual growth in compensation per employee stood at 4.1% in the last quarter of 2024, down from 4.5% in the previous quarter, while unit profits fell, continuing to buffer the impact of labour costs on inflation. Most measures of longer-term inflation expectations continued to stand at around 2%, which supports the sustainable return of inflation to our target.
Euro area headline inflation, as measured in terms of the Harmonised Index of Consumer Prices (HICP), decreased to 2.2% in March from 2.3% in February (Chart 8). This fall was mainly driven by a decline in services and energy inflation, which more than offset the rise in food inflation. The inflation outcome for the first quarter of 2025 was broadly in line with the March 2025 ECB staff macroeconomic projections for the euro area.
Chart 8
Headline inflation and its main components
(annual percentage changes; percentage point contributions)

Sources: Eurostat and ECB calculations.
Notes: “Goods” refers to non-energy industrial goods. The latest observations are for March 2025.
Energy inflation decreased to -1.0% in March 2025 from 0.2% in February. This decline mainly reflects a drop in the month-on-month growth rate of energy prices. Moreover, the detailed breakdown showed a strong decrease in the annual inflation rate for transportation fuels – related to falling oil prices – and, to a lesser extent, for electricity, while it increased for gas.
Food inflation rose to 2.9% in March 2025, up from 2.7% in February, largely due to an increase in unprocessed food inflation. The annual rate of change in unprocessed food prices picked up to 4.2% in March, compared with 3.0% in the previous month. This surge was driven by somewhat stronger than usual month-on-month growth of unprocessed food prices, potentially linked to unfavourable weather effects, and the weak developments of a year ago dropping out. Meanwhile, the annual rate of growth in processed food prices was unchanged at 2.6%, partly owing to the persistently high pressure from tobacco prices. The annual rate for processed food excluding the tobacco component was unchanged at 1.8%.
HICP inflation excluding energy and food (HICPX) decreased further to 2.4% in March, from 2.6% in the previous month. This decline was mainly due to a fall in services inflation, which decreased to 3.5% from 3.7% in February. Several factors contributed to the easing, including lower demand for recreation services, decreasing energy and wage cost pressures, and somewhat lower annual repricing effects at the beginning of the year. At the same time non-energy industrial goods (NEIG) inflation remained at 0.6%, consistent with ongoing moderate price pressures. This steady rate reflected a decline in non-durable goods inflation offset by the rise in semi-durable and durable goods inflation, although durable goods inflation remained in negative territory.
Most measures of underlying inflation have been developing in line with a sustained return of headline inflation to the 2% medium-term target (Chart 9).[1] The bulk of the indicator values ranged from 2.2% to 2.7%. Exclusion-based measures, such as the HICP excluding energy and HICP inflation excluding unprocessed food and energy, continued to ease. At the same time, the 10% trimmed mean was unchanged, and the 30% trimmed mean and the weighted median increased in March. Regarding model-based measures, the Supercore indicator (which comprises HICP items sensitive to the business cycle) decreased to 2.6% in March, from 2.7% in February. Meanwhile the Persistent and Common Component of Inflation (PCCI), which tends to outperform other indicators as a predictor of future headline inflation, decreased slightly to 2.2% in March after 2.3% in February and remained at the bottom of the range. Although the indicator for domestic inflation, which mostly covers services items, remained at a high level, it had been gradually easing since December 2024 and stood at 3.9% in March.
Chart 9
Indicators of underlying inflation
(annual percentage changes)

Sources: Eurostat and ECB calculations.
Notes: The grey dashed line represents the ECB’s inflation target of 2% over the medium term. The latest observations are for March 2025.
In February most indicators of pipeline price pressures for goods at the early stages of the pricing chain showed moderate upward shifts, while those indicators at the later stages eased slightly (Chart 10). At the early stages producer price inflation for domestic sales of intermediate goods increased to 0.9% in February, up from 0.5% in January. At the later stages, by contrast, the annual growth rates of producer prices for non-food consumer goods edged down to 1.5% in February from 1.6% in January. The annual growth rate of producer prices for manufactured food increased to 1.5% from 1.4% over the same period, confirming previous indications that the gradual easing of pipeline pressures had subsided in the manufactured food segment. The annual growth rate of import prices for non-food consumer goods remained unchanged at 1.5%. Meanwhile, import price inflation for manufactured food decreased to 9.9% in February from 10.7% in January, possibly reflecting the still high but easing growth rates of international food commodity prices. Overall, the latest data on producer and import prices confirm that the gradual easing of accumulated pipeline pressures on consumer goods prices has been fading but there has not been a noticeable resurgence.
Chart 10
Indicators of pipeline pressures
(annual percentage changes)
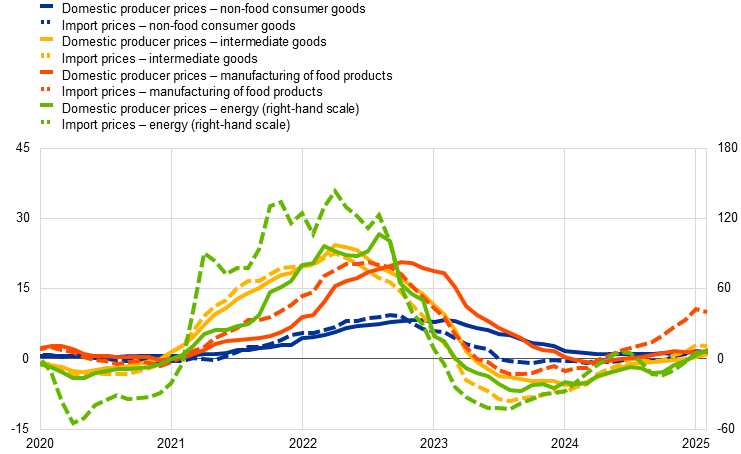
Sources: Eurostat and ECB calculations.
Note: The latest observations are for February 2025.
Domestic cost pressures, as indicated by growth in the GDP deflator, continued to ease in the fourth quarter of 2024, slowing to 2.5% from 2.7% in the previous quarter (Chart 11). This marks a substantial decline from the peak of 6.5% in the first quarter of 2023, although the rate remains above its long-term average before the COVID-19 pandemic of 1.6%. The deceleration in the GDP deflator was largely driven by a continued moderation in the growth of unit labour costs (3.7% in the fourth quarter of 2024, down from 4.5% in the third quarter). This slowdown reflects a combination of lower wage growth, measured in terms of compensation per employee (4.1% in the fourth quarter after 4.5% in the previous quarter), and an increase in productivity growth (to 0.4% from 0.0% in the previous quarter). The easing in actual wage growth was broadly in line with a decline in negotiated wage growth (to 4.1% in the fourth quarter of 2024, from 5.4% in the third quarter). While the negative contribution of unit profits to the GDP deflator diminished in the fourth quarter, they continued to buffer the still elevated growth in labour costs. Looking forward the ECB’s wage tracker, which incorporates data on wage agreements negotiated up to the first week of April 2025, suggests that wage growth pressures will continue easing throughout 2025. This outlook is supported by the latest survey indicators on wage growth, such as the ECB’s Corporate Telephone Survey, in which wage growth expectations for 2025 were revised downwards to 3.0% from 3.6% in the previous round.[2] The easing of wage growth pressures is consistent with both a decrease in demands for inflation compensation during negotiations and cooling labour demand.
Chart 11
Breakdown of the GDP deflator
(annual percentage changes; percentage point contributions)

Sources: Eurostat and ECB calculations.
Notes: Compensation per employee contributes positively to changes in unit labour costs. Labour productivity contributes negatively. The latest observations are for the fourth quarter of 2024.
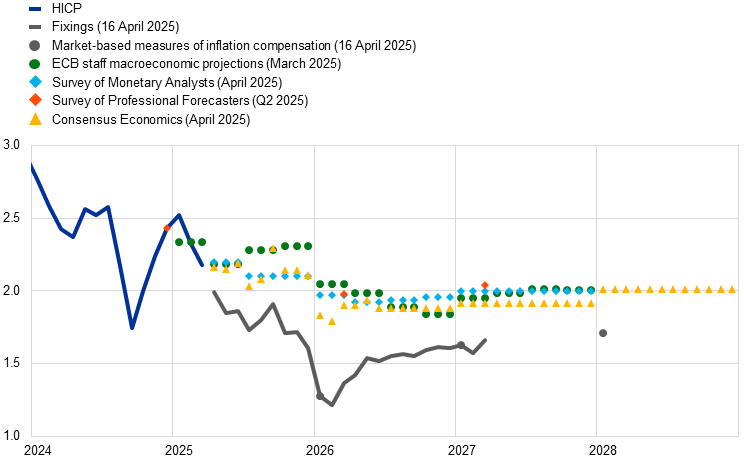
Market-based measures of near-term euro area inflation compensation, as measured by inflation fixings, have edged down to levels below 2% for the coming months (Chart 12). These measures – reflecting market participants’ expectations for HICP inflation excluding tobacco – suggest that investors expect this measure of inflation to fall below 2.0% in the coming months before declining further around the turn of the year to settle tangibly below 2% in mid-2026. Similarly, the one-year forward inflation-linked swap rate starting one year ahead declined to around 1.6% over the review period. On the consumer side, the March 2025 ECB Consumer Expectations Survey (CES) reported that the median rate of perceived inflation over the previous 12 months stood at 3.1% in March 2025 – the lowest rate since September 2021. At the same time median expectations for headline inflation over the next year increased to 2.9% in March from 2.6% in February. Median expectations for headline inflation three years ahead increased slightly as well, to 2.5% from 2.4% in the same period. The increase in consumer inflation expectations is linked to higher inflation uncertainty for some respondents.
Survey-based indicators of longer-term inflation expectations and market-based measures of longer-term inflation compensation remained stable, with most standing at around 2% (Chart 12). In both the ECB Survey of Monetary Analysts (SMA) for April 2025 (conducted between 31 March and 2 April) and the ECB Survey of Professional Forecasters (SPF) for the second quarter of 2025 (conducted between 1 and 4 April), median and average longer-term inflation expectations were unchanged at 2%. Longer-term market-based measures of inflation compensation (based on the HICP excluding tobacco) declined over the review period, with the five‑year forward inflation-linked swap rate five years ahead standing at around 2%. Furthermore, model-based estimates of genuine inflation expectations, excluding inflation risk premia, indicate that market participants continue to expect inflation to be around 2% in the longer term.
Chart 12
Headline inflation, inflation projections and expectations
a) Headline inflation, market-based measures of inflation compensation, inflation projections and survey-based indicators of inflation expectations
(annual percentage changes)
b) Headline inflation and ECB Consumer Expectations Survey
(annual percentage changes)

Sources: Eurostat, LSEG, Consensus Economics, ECB (SMA, SPF, CES), ECB staff macroeconomic projections for the euro area, March 2025, and ECB calculations.
Notes: In panel a) the market-based measures of inflation compensation series are based on the one-year spot inflation rate, the one-year forward rate one year ahead, the one-year forward rate two years ahead and the one-year forward rate three years ahead. The observations for market-based measures of inflation compensation are for 16 April 2025. Inflation fixings are swap contracts linked to specific monthly releases in euro area year-on-year HICP inflation excluding tobacco. The SPF for the second quarter of 2025 was conducted between 1 and 4 April 2025. The cut-off date for the Consensus Economics long-term forecasts was 7 April 2025. The March 2025 ECB staff macroeconomic projections for the euro area were finalised on 19 February 2025 and the cut-off date for the technical assumptions was 6 February 2025. In panel b) for the CES, the dashed lines represent the mean and the solid lines represent the median. The latest observations are for March 2025.
4 Financial market developments
During the review period from 6 March to 16 April 2025, euro area financial markets were heavily influenced by the changes in trade policies initiated by the United States. The announcement of sweeping US tariffs on 2 April led to the sharpest repricing of financial assets since the pandemic amid heightened volatility. The subsequent 90-day suspension of tariffs on most US trading partners provided only partial respite. Overall, the risk-free euro short-term rate forward curve shifted lower, with markets at the end of the review period pricing in around 85 basis points of cumulative interest rate cuts in the euro area by the end of 2025. Long-term sovereign bond yields also fell across jurisdictions, slightly outpacing the decline in risk-free rates. Euro area equity prices declined significantly amid high volatility, in particular after 2 April. Euro area corporate bond spreads widened for both investment-grade and, especially, high-yield issuers. In the foreign exchange market, the euro appreciated strongly both against the US dollar (5.2%) and in trade-weighted terms (3.3%).
During the review period, euro area risk-free rates declined amid heightened volatility driven by escalating trade tensions, resulting in a steepening of the forward curve. The benchmark euro short-term rate (€STR) averaged 2.45% over the review period, following the Governing Council’s widely anticipated decision to lower the key ECB interest rates by 25 basis points at its March meeting. Excess liquidity decreased by around €44 billion to €2,783 billion. This mainly reflected the decline in the portfolios of securities held for monetary policy purposes, with the Eurosystem no longer reinvesting the principal payments from maturing securities in its asset purchase programmes. After shifting upwards following the announcement of a planned fiscal expansion in Germany and the “ReArm Europe” initiative just before the review period, the forward curve gradually reversed a good part of its upward shift on the back of mounting international trade tensions. The US tariff announcement on 2 April and the subsequent escalation of global trade tensions resulted in a pronounced downward repricing of the forward curve, reflecting expectations of a faster pace of monetary policy easing in the euro area. By the end of the review period, markets were pricing in cumulative interest rate cuts of around 85 basis points by the end of 2025, about 40 basis points more than at the start of the period. Longer-term euro area risk-free rates also declined during the review period, albeit to a lesser extent, resulting in a steepening of the forward curve as the ten-year nominal overnight index swap (OIS) rate sank to 2.4%, which was 15 basis points lower than at the start of the review period.
Long-term sovereign bond yields also fell, with some variation across jurisdictions (Chart 13). The ten-year GDP-weighted euro area sovereign bond yield closed the review period at 3%, a decline of 31 basis points from its initial level, with spreads relative to the OIS rate narrowing by around 15 basis points. Sovereign bond spreads mostly tightened prior to the US Administration’s tariff announcement on 2 April as changes played out broadly equally across jurisdictions. Subsequently, the escalation of international trade tensions caused the dispersion across euro area sovereign bond yields to increase somewhat as investors shifted towards safer assets. Internationally, the ten-year US Treasury yield fluctuated significantly, rising by around 5 basis points to 4.3% by the end of the review period, while the ten-year UK sovereign bond yield declined by 7 basis points and ended the period at 4.6%.
Chart 13
Ten-year sovereign bond yields and the ten-year OIS rate based on the €STR
(percentages per annum)

Sources: LSEG and ECB calculations.
Notes: The vertical grey line denotes the start of the review period on 6 March 2024. The latest observations are for 16 April 2025.
Throughout the review period, trade tensions fuelled significant volatility in global and euro area stock markets, resulting in marked declines in equity prices. Stock prices declined more notably following the imposition of tariffs on automobile imports by the US Administration and in the run-up to the broad-based “reciprocal” tariffs announced on 2 April. Between the beginning of the year and the start of the review period, euro area equities had been outperforming their US counterparts as a shift in equity fund flows towards Europe partially counterbalanced the negative impact of trade tensions. However, the 2 April announcement, and the subsequent escalation in global trade tensions, triggered a global equity markets sell-off. After the US Administration implemented a 90-day pause on its “reciprocal” tariffs for all countries except China, stock prices partially recovered, despite heightened international trade uncertainty. Over the review period as a whole, euro area stock market indices fell by 8.5%, with non-financial corporation (NFC) and bank equities declining by 9.4% and 7.9% respectively. US stock market indices dropped by 8%, with declines of 9.9% for banks and 8.3% for NFCs.
Corporate bond spreads widened in both the investment-grade and the high-yield segments. The risk-off market sentiment was also reflected in corporate bond markets. The widening of spreads in the investment-grade segment was driven by an almost parallel widening of spreads on bonds issued by financial corporations and NFCs by around 30 basis points. The effect of the tariff announcement was more pronounced in the high-yield segment, where spreads on NFC bonds increased by 110 basis points and spreads on bonds issued by financial corporations widened by around 85 basis points.
In foreign exchange markets, the euro appreciated strongly, both against the US dollar and in trade-weighted terms (Chart 14). The nominal effective exchange rate of the euro – as measured against the currencies of 41 of the euro area’s most important trading partners – appreciated by 3.3% during the review period. This strong appreciation of the euro was broad-based. A 5.2% appreciation against the US dollar was largely driven by a shift in market expectations regarding the growth outlook in the United States and the potential impact of US policies after the US tariff announcements in early April. The euro also strengthened by 6.0% against the Chinese renminbi, with the latter currency weakening owing to the expected adverse impact of the US tariffs. The euro appreciated significantly against the Turkish lira amid country-specific developments in this emerging market economy which led to a broad weakening of its currency. Conversely, the euro depreciated by 3.2% against the Swiss franc amid market uncertainties and a broader risk-off market sentiment.
Chart 14
Changes in the exchange rate of the euro vis-à-vis selected currencies
(percentage changes)

Source: ECB calculations.
Notes: EER-41 is the nominal effective exchange rate of the euro against the currencies of 41 of the euro area’s most important trading partners. A positive (negative) change corresponds to an appreciation (depreciation) of the euro. All changes have been calculated using the foreign exchange rates prevailing on 16 April 2025.
5 Financing conditions and credit developments
The latest official statistics on corporate borrowing, which were published on 2 April 2025, show that the ECB’s interest rate cuts have again made it less expensive for firms to borrow. In February average bank funding costs remained close to the recent peak, while bank lending rates to firms continued their gradual decline from peak levels. Average interest rates on new loans to firms fell in February to 4.1%, while those on new mortgages rose slightly to 3.3%. Growth in loans to firms and households continued to increase in February, but remained far below historical averages, reflecting still weak demand and tight credit standards. Over the period from 6 March to 16 April 2025, the cost to firms of equity financing rose, owing to the higher equity risk premium, while the cost of market-based debt financing remained virtually unchanged. According to the April 2025 euro area bank lending survey, credit standards for loans to firms again tightened slightly in the first quarter of 2025 and net loan demand decreased slightly, after a modest recovery in previous quarters. Credit standards for housing loans eased and net housing loan demand continued to increase strongly. In the Survey on Access to Finance of Enterprises (SAFE) for the first quarter of 2025, which was conducted between 10 February and 21 March 2025, firms reported a decline in bank interest rates and a further slight tightening of other loan conditions. Firms also indicated a small reduction in the need for bank loans and broadly unchanged bank loan availability. The annual growth rate of broad money (M3) increased further to 4.0% in February.
Marginal bank funding costs decreased further in February 2025, while average funding costs for euro area banks saw only marginal declines. The composite cost of debt financing for euro area banks, i.e. the index which measures marginal bank funding costs, fell in February (Chart 15, panel a), driven by rate cuts and an increased preference for liquidity on the part of firms and households, while average bank funding costs decreased only marginally. Deposit rates and interbank money market rates continued to fall, with the composite deposit rate standing at 1.1% in February compared with a peak of 1.4% in May 2024. Bank bond yields rose in early March and declined again thereafter, amid heightened macroeconomic and geopolitical uncertainty (Chart 15, panel b). Interest rates on time deposits for firms and households fell more sharply than those on overnight deposits. As a result, the significant gap between interest rates on time and overnight deposits continued to narrow for both firms and households, reflecting the somewhat larger fall in the remuneration of deposits with an agreed maturity.
Chart 15
Composite bank funding costs in selected euro area countries
(annual percentages)

Sources: ECB, S&P Dow Jones Indices LLC and/or its affiliates, and ECB calculations.
Notes: Composite bank funding costs are an average of new business costs for overnight deposits, deposits redeemable at notice, time deposits, bonds and interbank borrowing, weighted by their respective outstanding amounts. Average bank funding costs use the same weightings but are based on rates for outstanding deposits and interbank funding, and on yield to maturity at issuance for bonds. Bank bond yields are monthly averages for senior tranche bonds. The latest observations are for February 2025 for the composite cost of debt financing for banks (panel a) and for 16 April 2025 for bank bond yields (panel b).
The euro area banking sector remained resilient, with strong capital positions and still high levels of profitability, despite headwinds related to weak economic growth. In the fourth quarter of 2024, bank capitalisation continued to be broadly stable, with capital ratios well above 15% and voluntary capital buffers exceeding Common Equity Tier 1 (CET1) requirements. Banks’ return on equity remained high, standing at 10% in the fourth quarter of 2024, despite an increase in provisioning needs in some asset classes and support from net interest income having declined from the peak seen in the first quarter of 2024. With interest rates still at elevated levels, asset quality continued to slowly deteriorate, with considerable cross-country variation. Non-performing loan ratios were stable, being close to the historical lows seen in the first quarter of 2023. The proportion of underperforming (i.e. Stage 2) loans increased substantially in 2024, especially as regards small firms and commercial real estate, and banks have increased their loan loss provisions to reflect this.
Bank lending rates for firms declined further, while rates for households levelled out in February. Lending rates have fallen since the summer of 2024, reflecting lower policy rates (Chart 16). In February 2025 lending rates for new loans to non-financial corporations (NFCs) fell by 15 basis points to stand at 4.10%, around 1.2 percentage points below their October 2023 peak (Chart 16, panel a). This decline was widespread across the largest euro area countries and concentrated in loans with maturities of up to one year. In contrast, rates on loans with maturities of more than one year increased in response to the rise in longer-term risk-free rates. For firms, the cost of issuing market-based debt declined to 3.5% in February, but there has been some upward pressure more recently and rates rose to 3.7% in April (Chart 17). The spread between interest rates on small and large loans to firms widened somewhat in February to 0.47 percentage points, slightly above its historical low and amid cross-country heterogeneity. In contrast, lending rates on new loans to households for house purchase increased by 8 basis points to stand at 3.33% in February, 70 basis points below their November 2023 peak (Chart 16, panel b), with variation across countries. This rise was due to developments in long-term rates and was more pronounced for longer maturities.
Chart 16
Composite bank lending rates for firms and households in selected euro area countries
(annual percentages)

Sources: ECB and ECB calculations.
Notes: NFCs stands for non-financial corporations. Composite bank lending rates are calculated by aggregating short and long-term rates using a 24-month moving average of new business volumes. The latest observations are for February 2025.
Over the period from 6 March to 16 April 2025, the cost to firms of equity financing rose, while the cost of market-based debt financing remained virtually unchanged. Based on the monthly data available until February 2025, the overall cost of financing for NFCs – i.e. the composite cost of bank borrowing, market-based debt and equity – increased in February compared with the previous month and stood at 5.7%, below the multi-year high reached in October 2023 (Chart 17).[3] This was the result of a rise in the cost of equity owing to a higher equity risk premium, all the other cost components having either declined or remained unchanged. Daily data covering the period from 6 March to 16 April 2025 show that the cost of market-based debt financing remained stable, driven by a downward shift in the overnight index swap (OIS) curve at the medium and long-term maturities that was almost completely offset by the widening of corporate bond spreads, especially on bonds in the high yield sector. The cost of equity financing rose over the same period in response to the strengthening of the equity risk premium and despite the decline in the long-term risk-free rate, as approximated by the ten-year OIS rate.
Chart 17
Nominal cost of external financing for euro area firms, broken down by component
(annual percentages)

Sources: ECB, Eurostat, Dealogic, Merrill Lynch, Bloomberg, LSEG and ECB calculations.
Notes: The overall cost of financing for non-financial corporations (NFCs) is based on monthly data and is calculated as a weighted average of the long and short-term cost of bank borrowing (monthly average data), market-based debt and equity (end-of-month data), based on their respective outstanding amounts. The latest observations are for 16 April 2025 for the cost of market-based debt and the cost of equity (daily data), and for February 2025 for the overall cost of financing and the cost of borrowing from banks (monthly data).
Growth in loans to firms and households continued to increase gradually in February, reflecting still weak demand and tight credit standards. The annual growth rate of bank lending to firms rose to 2.2% in February 2025, up from 2.0% in January and well below its historical average of 4.8% (Chart 18, panel a). The increase was mainly driven by short-term loans (up to one year). Corporate debt securities issuance in February was relatively weak, following a series of volatile months, and grew at a stable rate of 3.2% in annual terms. The annual growth rate of loans to households improved, rising to 1.5% in February from 1.3% in January, although it remained well below its historical average of 4.1% (Chart 18, panel b). Loans for house purchases continued to be the primary driving force behind this upward trend, while consumer credit stabilised, with annual growth standing at 3.9% in February. By contrast, other lending to households, including loans to sole proprietors, was again weak. The ECB’s Consumer Expectations Survey in February showed that the percentage of households who perceived credit access to have been tighter still outweighs that perceiving credit access to have been easier, but looking ahead, households expect credit access to ease somewhat over the next 12 months.
Chart 18
MFI loans in selected euro area countries
(annual percentage changes)

Sources: ECB and ECB calculations.
Notes: Loans from monetary financial institutions (MFIs) are adjusted for loan sales and securitisation; in the case of non-financial corporations (NFCs), loans are also adjusted for notional cash pooling. The latest observations are for February 2025.
According to the April 2025 euro area bank lending survey, banks reported a small further tightening of credit standards for loans or credit lines to firms in the first quarter of 2025 and a moderate easing of credit standards for housing loans (Chart 19). The continued tightening of credit standards for loans to firms in the first quarter of 2025 was smaller than banks had expected in the previous round and was again driven by higher perceived risks related to the economic outlook and to the industry and firm-specific situations. Banks reported a moderate easing of credit standards for loans to households for house purchase, whereas a small further tightening was indicated for consumer credit. For housing loans, competition from other banks was the main driver of this easing, while the tightening of credit standards for consumer credit was primarily attributable to risk perceptions. Banks reported a broadly unchanged share of rejected applications for loans to large firms and for consumer credit, but a small net decrease for housing loans and a further increase for loans to small and medium-sized enterprises (SMEs). For the second quarter of 2025, euro area banks expect a further tightening of credit standards for loans to firms, consumer credit and housing loans.
In the first quarter of 2025, banks reported a further small decline in loan demand by firms, after two quarters of weak recovery, and a strong increase in housing loan demand. Loan demand by firms decreased, primarily owing to a negative contribution from firms’ inventories and working capital and despite support from falling interest rates. Fixed investment continued to have a broadly neutral impact on loan demand, with some banks referring to economic and geopolitical uncertainties as a dampening factor for firms’ longer-term planning. For housing loans, the strong increase in demand primarily reflected declining interest rates and, to a lesser extent, improving housing market prospects and rising consumer confidence. The moderate increase in demand for consumer credit was mainly supported by declining interest rates, with further small contributions from consumer confidence and spending on durable goods. For the second quarter of 2025, banks expect a small rise in loan demand by firms and further increases for households, especially for housing loans.
Chart 19
Changes in credit standards and net demand for loans to NFCs and loans to households for house purchase
(net percentages of banks reporting a tightening of credit standards or an increase in loan demand)

Source: Euro area bank lending survey.
Notes: NFCs stands for non-financial corporations. For survey questions on credit standards, “net percentages” are defined as the difference between the sum of the percentages of banks responding “tightened considerably” and “tightened somewhat” and the sum of the percentages of banks responding “eased somewhat” and “eased considerably”. For survey questions on demand for loans, “net percentages” are defined as the difference between the sum of the percentages of banks responding “increased considerably” and “increased somewhat” and the sum of the percentages of banks responding “decreased somewhat” and “decreased considerably”. The diamonds denote expectations reported by banks in the current round. The latest observations are for the first quarter of 2025.
According to the banks surveyed, access to funding remained broadly unchanged, while perceived risks to credit quality weighed on lending conditions. In the first quarter of 2025, banks’ access to retail funding remained broadly unchanged, but eased for debt securities, money markets and securitisations. Banks indicated that the reduction of the ECB’s monetary policy asset portfolio had had a small negative impact on their financing and lending conditions over the past six months, as well as on their liquidity positions, and that the impact on credit standards had been broadly neutral. Euro area banks reported a tightening impact of non-performing loan ratios and other indicators of credit quality on their lending conditions for loans to firms and for consumer credit in the first quarter of 2025, while the impact for housing loans had been neutral. Banks also reported a further negative net impact of the past and expected ECB key interest rate decisions on their net interest margins over the past six months, while the impact via volumes had remained slightly negative. Banks expect a similar negative net impact of ECB key interest rate decisions on their margins over the next six months, which is expected to be a drag on overall profitability, despite the slightly positive contribution from asset volumes.
In the latest Survey on Access to Finance of Enterprises (SAFE), firms reported a further decrease in bank interest rates, while still indicating a tightening of other loan conditions. The first quarter of 2025 saw a marked increase in the net number of large firms observing a decline in interest rates, while, on net, SMEs indicated that interest rates had remained broadly unchanged. At the same time, a net 24% of firms (up from 22% in the fourth quarter of 2024) pointed to a rise in other financing costs, such as charges, fees and commissions, and a net 13% (down from 15% in the fourth quarter of 2024) reported stricter collateral requirements.
Chart 20
Changes in euro area firms’ bank loan needs, current and expected availability and financing gap
(net percentages of respondents)

Sources: Survey on Access to Finance of Enterprises (SAFE) and ECB calculations.
Notes: SMEs stands for small and medium-sized enterprises. Net percentages are the difference between the percentage of firms reporting an increase in availability of bank loans (needs and expected availability respectively) and the percentage reporting a decrease in availability in the past three months. The indicator of the perceived change in the financing gap takes a value of 1 (-1) if the need increases (decreases) and availability decreases (increases). If firms perceive only a one-sided increase (decrease) in the financing gap, the variable is assigned a value of 0.5 (-0.5). A positive value for the indicator points to a widening of the financing gap. Values are multiplied by 100 to obtain weighted net balances in percentages. Expected availability has been shifted forward by one period to allow for a direct comparison with realisations. The figures refer to Pilot 2 and Rounds 30 to 34 of the SAFE (October-December 2023 to January-March 2025).
Firms saw a small reduction in the need for bank loans and broadly unchanged bank loan availability, although a modest improvement in availability is anticipated over the next three months (Chart 20). The net percentage of firms reporting a decline in the availability of bank loans was 1% (down from 2% in the previous quarter). Although availability diminished slightly for SMEs, it remained unchanged for large firms. These developments were echoed by the slight net tightening of banks’ lending policies, and in particular of credit standards, as highlighted by the euro area bank lending survey for the same period. The bank loans financing gap indicator – an index capturing the difference between changes in needs and availability – was broadly unchanged. Looking ahead, firms expect to see a modest improvement in bank loan availability over the next three months.
Broad money (M3) growth stabilised in February, amid progressive weakening of net foreign inflows and a gradual recovery in lending to firms and households (Chart 21). Annual M3 growth strengthened further to 4.0% in February, up from 3.8% in January. Annual growth of narrow money (M1) – which comprises the most liquid assets of M3 – increased markedly, rising to 3.5% in February compared with 2.7% in January. The increase was driven by the ongoing surge in the annual growth rate of overnight deposits, which rose to 3.8% in February, up from 2.9% in January, reflecting investors’ heightened preference for liquidity in an environment of heightened uncertainties and amid falling interest rates on savings deposits. Net foreign flows, albeit weakening, and the progressive recovery in bank lending to firms and households made a positive contribution to money creation in February, and bank net purchases of government securities slowed, amid a substantial decrease in the net issuance of government bonds. At the same time, the ongoing contraction of the Eurosystem balance sheet and the issuance of long-term bank bonds (which are not included in M3) continued to contribute negatively to M3 growth.
Chart 21
M3, M1 and overnight deposits
(annual percentage changes, adjusted for seasonal and calendar effects)

Source: ECB.
Note: The latest observations are for February 2025.
1 Challenges to the resilience of US corporate bond spreads
Prepared by Mar Domenech Palacios and Martina Jančoková
Prior to the recent abrupt widening, US corporate bond spreads experienced a prolonged phase of unusual resilience, despite a backdrop of elevated interest rates. Throughout 2024, the risk premium required by investors to hold US corporate debt over government securities – as measured by non-financial corporate bond spreads – remained remarkably compressed. Investment-grade corporate bond spreads ranged between 83 and 112 basis points, while high-yield spreads fluctuated between 264 and 393 basis points. Spreads stood at their lowest levels in nearly two decades, falling within the first quintile of the historical spread distribution since 1999 (see Chart A). However, more recently, US corporate spreads have widened significantly, increasing to 120 basis points for investment-grade and 461 basis points for high-yield bonds. This abrupt shift has coincided with the announcement of new tariffs by the US administration, which has triggered a sharp deterioration in market risk sentiment. Against this backdrop, and in light of the recent market repricing, this box examines the factors that contributed to the previous resilience of US corporate bond spreads and assesses the potential risks of spread decompression in the period ahead.
More2 The implications of US-China trade tensions for the euro area – lessons from the tariffs imposed by the first Trump Administration
Prepared by Vanessa Gunnella, Giovanni Stamato and Alicja Kobayashi
This box examines how the tariffs that the United States introduced on Chinese products in 2018 influenced euro area trade patterns. It looks at whether euro area exporters were able to gain market share in the United States as their competitiveness increased vis-à-vis their Chinese counterparts. It also assesses how Chinese export patterns changed, highlighting how Chinese exports were diverted from the United States to alternative markets, including the euro area. Examining the outcomes of these past measures can give an indication of the potential channels through which current US tariffs on Chinese goods could affect the euro area.
More3 Who wants to work more? Revisiting the decline in average hours worked
Prepared by Clémence Berson and Marco Weissler
In most euro area countries, average hours worked (AHW) per employee have been falling since 2020 and remain below their pre-pandemic levels. The decline was particularly strong in 2020 owing to policy measures to reduce the spread of COVID-19.[4] National accounts data show that, in the fourth quarter of 2024, AHW were still 1.8% lower than a decade before (Chart A) despite the proportion of part-time workers remaining broadly stable over the same period. This decline has been accompanied by rising employment. Over the past decade, employment across the euro area has grown by 13.1% – approximately 19.9 million people. Therefore, total hours worked increased despite the decrease in AHW per employee. In this box, we use data from the European Union Labour Force Survey (LFS) to assess the extent to which the fall in AHW was driven by workers working zero hours (e.g. because of holiday or sick leave) or long hours (e.g. because of overtime) during the reference week.[5]
More4 Main findings from the ECB’s recent contacts with non‑financial companies
Prepared by Gabe de Bondt, Richard Morris and Moreno Roma
This box summarises the findings of recent contacts between ECB staff and representatives of 79 leading non-financial companies operating in the euro area. The exchanges took place between 17 and 26 March 2025, before the US tariff announcements on 26 March and 2 April.[6]
More5 Long-term inflation expectations of consumers: an overview
Prepared by Pedro Baptista, Colm Bates, Omiros Kouvavas, Justus Meyer and Katia Werkmeister
The measures of inflation expectations published in the ECB Consumer Expectations Survey (CES) have, starting with the April 2025 data release, been complemented with a new measure of five-year-ahead inflation expectations. Previously, going back to April 2020, the CES only set out monthly measures of consumers’ short-term (one year ahead) and medium-term (three years ahead) inflation expectations. While expectations for inflation three years ahead are of particular importance for assessing medium-term inflation risks, starting in August 2022, the CES added a five-year-ahead expectations measure to augment the ECB’s ability to monitor longer-term inflation expectations.[7],[8] This box examines developments in these long-term (five years ahead) inflation expectations and their use for assessing the degree to which inflation expectations are anchored.
More6 The 2021-24 inflation surge through the lens of the ECB-BASE model
Prepared by Elena Angelini, Matthieu Darracq Pariès and Srečko Zimic
The implications of Russia’s war on Ukraine, which were not anticipated in the December 2021 Eurosystem staff macroeconomic projections for the euro area, led to large projection errors in 2022.[9] The error in HICP inflation vis-à-vis the December 2021 projection was close to 8 percentage points at the end of 2022, while the error in GDP growth was smaller – but also substantial –, standing at almost 1 percentage point (Chart A).
More7 Introducing statistical in-house credit assessment systems (S-ICASs) as an additional source of credit assessments under the general collateral framework
Prepared by Cláudia Duarte, Janina Engel, Oleg Reichmann and Tomislav Džaja
The credit quality assessment of collateral assets for Eurosystem credit operations is based on the Eurosystem Credit Assessment Framework (ECAF).[10] Credit operations are a key element of the Eurosystem’s monetary policy operations. The Eurosystem has a statutory requirement to lend to banks and other counterparties only against adequate collateral.[11] Currently, the ECAF builds on credit assessment information from three sources: the in-house credit assessment systems (ICASs) of national central banks (NCBs), external credit assessment institutions (ECAIs) and the internal ratings-based (IRB) systems of Eurosystem counterparties.[12]
More8 The macroeconomic impact of euro area discretionary fiscal policy measures since the start of the pandemic
Prepared by Elena Angelini, Krzysztof Bańkowski, Cristina Checherita-Westphal, Philip Muggenthaler-Gerathewohl and Srečko Zimic
This box provides a model-based analysis of the macroeconomic impact of discretionary fiscal policy measures adopted by euro area governments since the start of the COVID-19 pandemic, as reflected in the March 2025 ECB staff projections for the euro area.[13] The analysis investigates the effects of these measures on real GDP growth and inflation, in comparison with a counterfactual scenario of no fiscal policy support as of 2020. It employs two quantitative tools that are regularly used for projections and policy simulations at the ECB: Basic Model Elasticities (BMEs) and the ECB-BASE model.[14] The focus is on the macroeconomic impact of the discretionary fiscal policy measures, which are proxied by the change in the discretionary fiscal policy impulse compared with 2019, the year prior to the pandemic.[15] The box also assesses the impact of support measures introduced by euro area governments since late 2021 in response to the energy crisis and high inflation.[16]
More1 Medium-term fiscal-structural plans under the revised Stability and Growth Pact
Prepared by Othman Bouabdallah, Cristina Checherita-Westphal, Roberta De Stefani, Stephan Haroutunian, Sebastian Hauptmeier, Christian Huber, Daphne Momferatou, Philip Muggenthaler-Gerathewohl, Ralph Setzer and Nico Zorell
The EU’s new economic governance framework builds on the premise that fiscal sustainability, reforms and investments are mutually reinforcing and should be fostered as part of an integrated approach.[17] Following a comprehensive reform, the revised framework – notably including the revised Stability and Growth Pact (SGP) – entered into force on 30 April 2024, allowing its application as of 2025. The reformed SGP aims at ensuring sustainable fiscal positions, which are key for price stability and sustainable growth in a smoothly functioning Economic and Monetary Union. In addition, the SGP aims to balance fiscal adjustment needs with the need to enhance the implementation of productive investment and reforms, with a particular focus on strategically relevant areas such as the green and digital transitions and defence.
More https://www.ecb.europa.eu/pub/pdf/ecbu/ecb.eb_annex202503~de6d86cd7c.en.pdf© European Central Bank, 2025
Postal address 60640 Frankfurt am Main, Germany
Telephone +49 69 1344 0
Website www.ecb.europa.eu
All rights reserved. Reproduction for educational and non-commercial purposes is permitted provided that the source is acknowledged.
For specific terminology please refer to the ECB glossary (available in English only).
The cut-off date for the statistics included in this issue was 16 April 2025.
PDF ISSN 2363-3417, QB-01-25-045-EN-N
HTML ISSN 2363-3417, QB-01-25-045-EN-Q
Distribution channels: Banking, Finance & Investment Industry
Legal Disclaimer:
EIN Presswire provides this news content "as is" without warranty of any kind. We do not accept any responsibility or liability for the accuracy, content, images, videos, licenses, completeness, legality, or reliability of the information contained in this article. If you have any complaints or copyright issues related to this article, kindly contact the author above.
Submit your press release